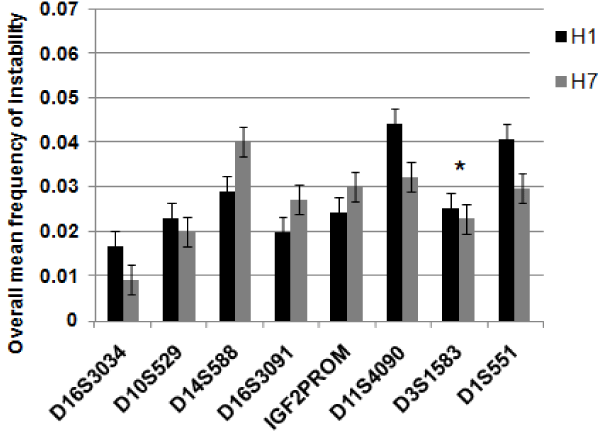
| Differences in overall mean mutation frequencies were observed between EBs from H1 and H7 ES cell lines. Values represent the overall mean mutation frequency of EB sample replicates (n=144) per marker that was calculated with SP-PCR software (MD Anderson Cancer Houston, TX). D16S3091 and IGF2-PROM markers showing a highly statistically significance differences (p<0.001). D16S3034, D10S529, D14S588, D11S4090, and D1S551 markers show high statistically significant differences (p≤0.05). The D3S1583 marker did not show any significance differences (*). |