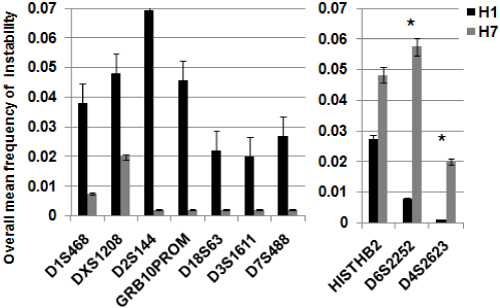
| Statistically significant differences in overall mean mutation frequencies were
observed between EBs from H1 and H7 ES cell lines. (A) Overall mean values
for mutation frequencies of unstable markers observed in EBs from the H1
ES cell line. (B) Overall mean values for mutation frequencies of unstable
markers observed in EBs from the H7 ES cell line. Values represent the
overall mean mutation frequency of EB sample replicates (n=144) per marker
that was calculated with SP-PCR software (MD Anderson Cancer Houston,
TX). Markers show statistically significant differences p ≤ 0.05 except for
D6S2252 and D4S2623 that show marginally significant differences *p ≤ 0.10. |

