 |
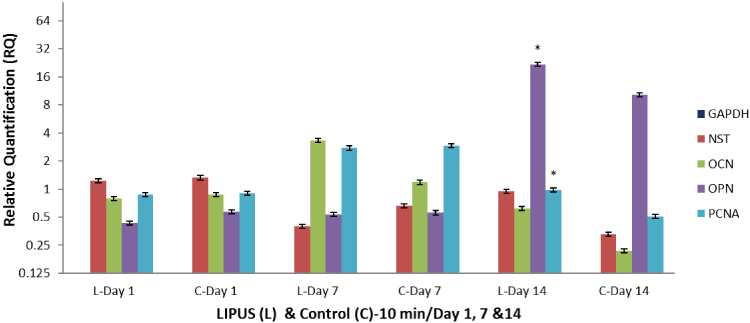
| qPCR comparison of levels of nucleostemin, osteocalcin, osteopontin, and PCNA after their equalization to the endogenous control gene (GAPDH) between LIPUS (L) and control (C) on days 1, 7, and 14 in osteogenic media. Cells were at P4 (n=27*3), data represent quantification from 3 biological replicates, error has indicated standard deviation. (* indicate statistically significant) |
| Figure 3: Q-PCR of HUCPV-Cs (NST, OCN, OPN and PCNA equalized to GAPDH) treated with 10 min/ LIPUS at Day 1,7 and 14- OST Media. |