|
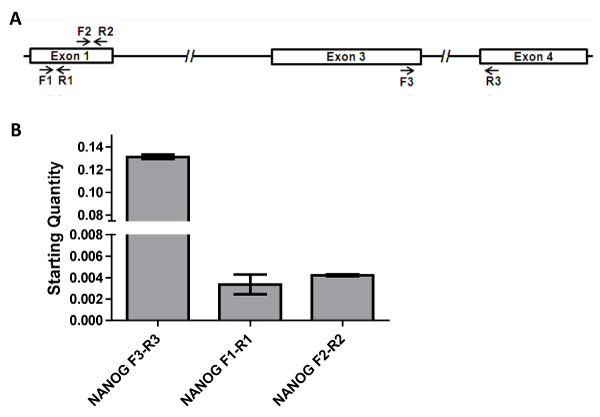
| Figure 2: Novel NANOG transcripts in human ESCs. (A) A schematic of the updated NANOG gene structure showing the location of the two primer pairs used to detect the exon 1 originating transcripts. The F3-R3 primer pair hybridizing to exons 3 and 4, respectively, was used to measure the total expression levels of total NANOG. qRT-PCR was used to measure the expression levels of total and novel NANOG transcripts initiating from the upstream exon 1 using RNA isolated from human H13 ESCs. The expression of upstream NANOG transcription is verified by two independent primer pairs. Levels shown are relative to a GAPDH control. |