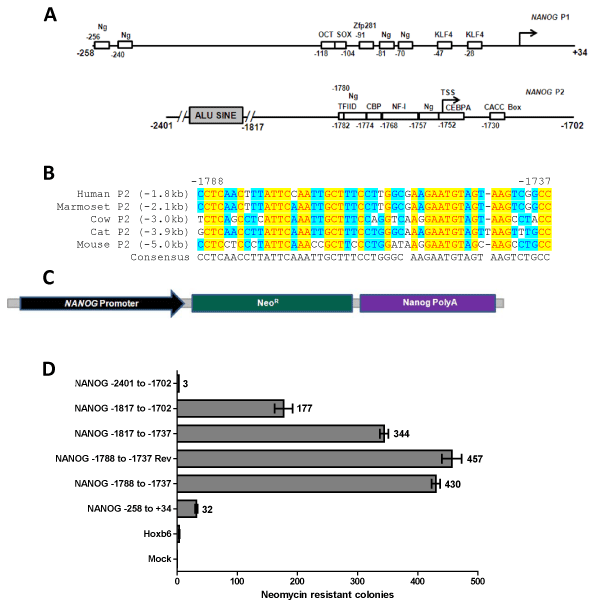
 (A) Schematic of the two NANOG promoters P1
(proximal promoter, upper) and P2 (distal promoter, below) showing the
transcription factor binding sites in rectangular boxes with their respective
positions to the TSS. KLF4, OCT4 and SOX2 are validated sites, whereas the
NANOG binding sites are predicted by the presence of the tetramer ATTA/C.
P2 shows transcription factor binding sites that are predicted by TRANSFAC.
(A) Schematic of the two NANOG promoters P1
(proximal promoter, upper) and P2 (distal promoter, below) showing the
transcription factor binding sites in rectangular boxes with their respective
positions to the TSS. KLF4, OCT4 and SOX2 are validated sites, whereas the
NANOG binding sites are predicted by the presence of the tetramer ATTA/C.
P2 shows transcription factor binding sites that are predicted by TRANSFAC.
(B) Alignment of the upstream P2 promoter in mouse, cat, cow, marmoset and human showing that the NANOG P2 is moving closer to the TSS across evolutionary time.
(C) A schematic of the plasmid showing the design used for the neomycin resistance assay.
(D) Neomycin resistant colonies produced by the respective promoters are plotted. Control cells were mock-transfected and the Hoxb6 promoter was used as a negative control as it is not active in ESCs.