 |
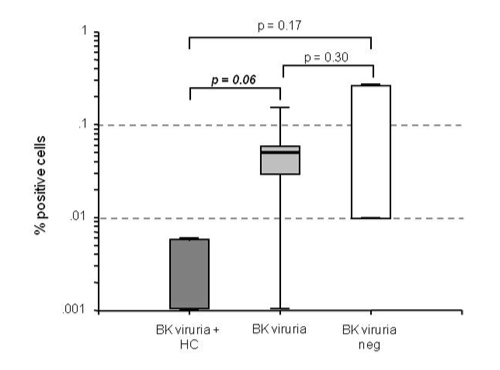
| Figure 2: Frequency of BKV-specific CD8+/IFNg+ cells after 24h stimulation with VP1 and T peptides. Percentage of BKV-specific CD8+/IFNg+ cells is represented on a logarithmic scale. All P values are reported those between 0.05 and 0.1 are marked in italics. Evaluated groups: group 1: donors whose recipients developed HC; group 2: donors whose recipients showed BK viruria; group 3: donors whose recipients without BK viruria. |