 |
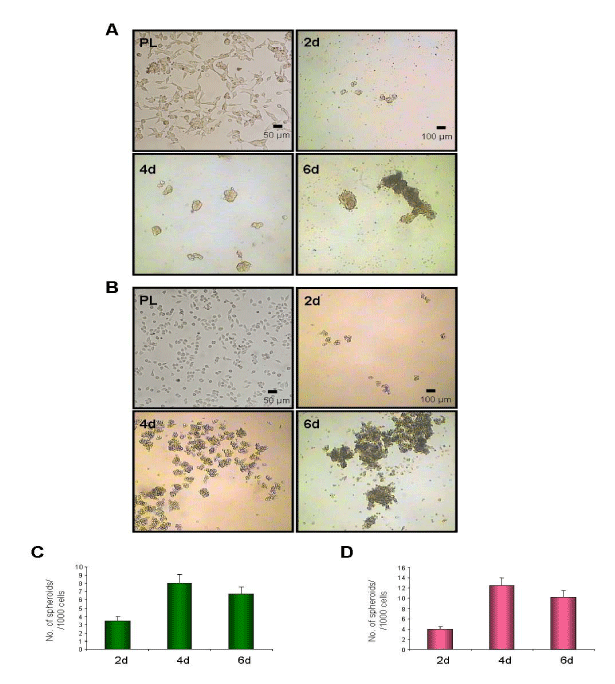
| Figure 1: Morphological changes of (A) LNCaP and (B) PC3 prostate cancer cells grown in different culture conditions. C and D, numbers of cell spheroids in A and B, respectively. PL, plastic (2D cell cultures); 2-4-6d, 2-4-6 days of 3D cell culture. Data in C and D are expressed as means ±SD from three independent experiments. |