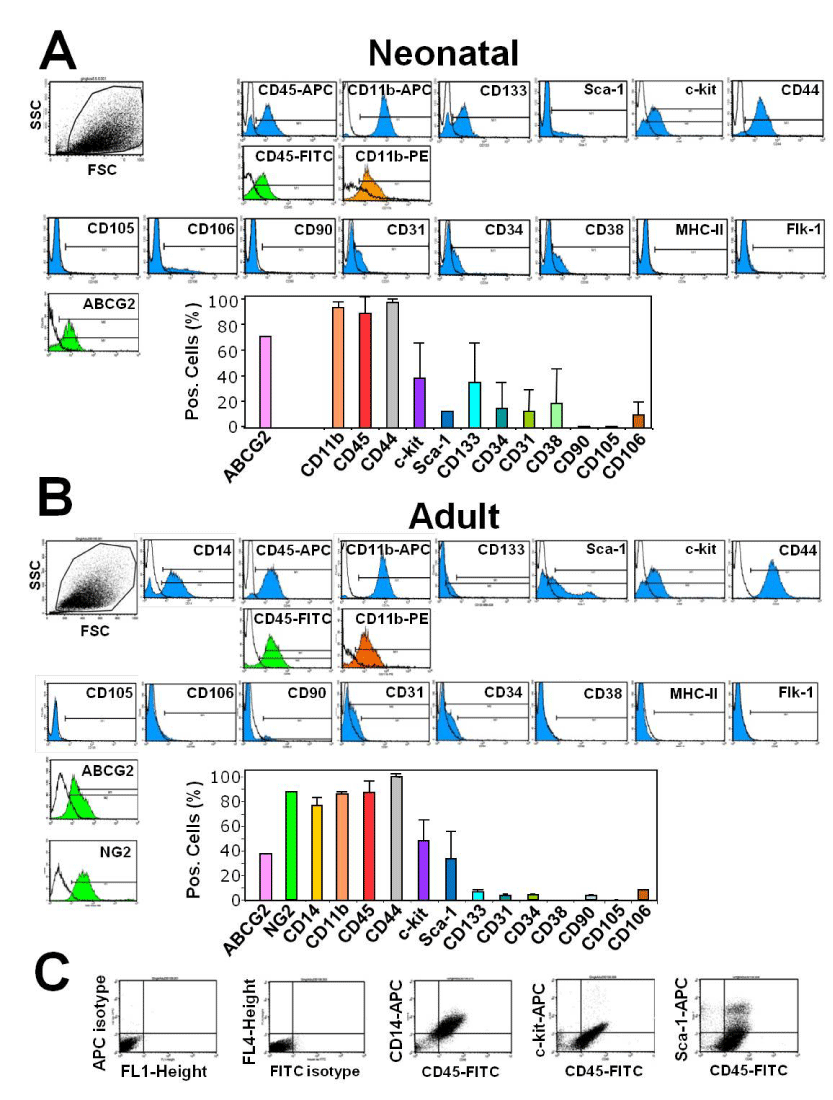
A. Cells from neonatal mice. Flow cytometric plots from a representative analysis 5 months after cell isolation (two different antibodies were used for CD45 and CD11b analysis); bar histogram showing mean values (+ SD) from 5 independent analyses (2-5 months after cell isolation), excepted for ABCG2 and Sca-1 (1 analysis).
B. Cells from adult mice. Flow cytometric plots from a representative analysis 9 months after cell isolation; bar histogram showing mean values (+ SD) from 3 independent analyses (2-9 months after cell isolation), excepted for ABCG2, NG2 and CD106 (1 analysis).
C. Double-label analyses of CD45, CD14, c-kit, and Sca-1 expression.