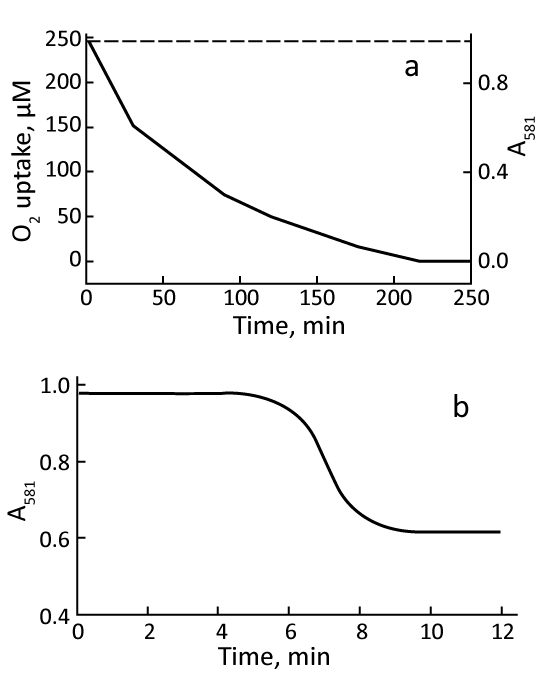
b) Kinetics of O2 release from MbO2 in the presence of frozen rat liver mitochondria.
MbO2 concentration, 0.07 mM, 1 mg/ml of mitochondrial protein. Incubation medium and experimental conditions see in a).
 |
| Figure 1: a) Kinetics of O2 uptake by frozen rat liver mitochondria in the
polarographic cell (solid curve) and variations of MbO2 spectrum (dashed
curve). Experimental conditions: mitochondrial suspension, 0.9 ml, with
concentration of 30 mg/ml of mitochondrial protein is put into a closed dialysis
bag placed into the sealed polarographic cell with 12.5 ml of MbO2 solution
(0.07 mM). Incubation medium: Tris-HCl buffer, 10 mM; sucrose, 150 mM; KCl,
100 mM; EGTA, 0.5 mM; KH2PO4, 5 mM; succinate, 15 mM, pH 7.4. b) Kinetics of O2 release from MbO2 in the presence of frozen rat liver mitochondria. MbO2 concentration, 0.07 mM, 1 mg/ml of mitochondrial protein. Incubation medium and experimental conditions see in a). |