 |
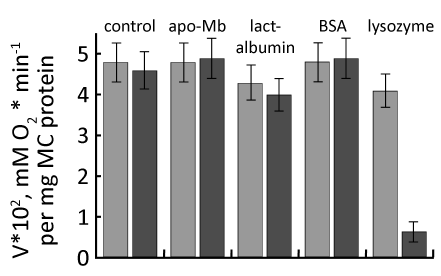
| Figure 3: Effect of different proteins (0.25 mM) on rate of O2 uptake by frozen rat liver mitochondria in the presence of MbO2 solution (0.11 mM), V1 (light columns), and the rate of MbO2 deoxygenation in the presence of mitochondria, V2 (dark columns). Incubation medium and experimental conditions see in legend to Figure 1. |