 |
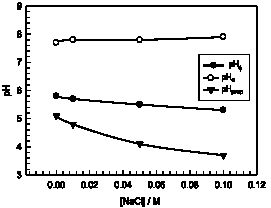
| Figure 5: The plot shows the variation of pHc, pHΦ and pHprep as function of NaCl concentration. Note that pHc and pHΦ are invariant of NaCl concentration while and pHprep shows a decreasing trend with increase in NaCl concentration. Solid lines are guide to the eye. Reproduced with permission from American Chemical Society [12]. |