|
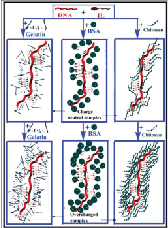
| Figure 9: Schematic representation of DNA-Polyion binding. The figure depicts the two distinct interaction regions: charge neutralized (primary binding) followed by overcharged complex (secondary binding). [95] - Reproduced by permission of the PCCP Owner Societies. |