|
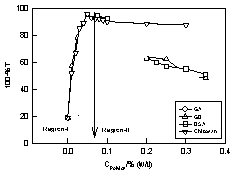
| Figure 15: Plot of solution turbidity measured at 450 nm as function of polyion concentration with the IL concentration fixed at 0.05%. DNA concentration was maintained at 0.005% for GA and 0.05% for others polyions while polyion concentration was varied from 0-5%. Maximum associative interaction was noticed at 0.05% for Chitosan whereas for others it was noticed at 0.075%. Region-I is characterized by formation of soluble complexes. In Region-II, GA and chitosan follow one pattern while GB and BSA show a different behaviour. All measurements were performed at pHc. [95] - Reproduced by permission of the PCCP Owner Societies. |