 |
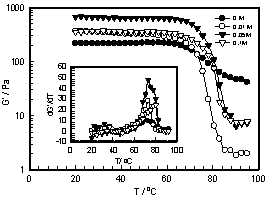
| Figure 20: Plot of storage modulus, G’ as function of temperature for coacervate samples. A sharp drop in G’ value indicates a melting transition. The temperature derivative of G’ is shown in the inset where peaks indicate melting temperature. Solid lines are guide to the eye. Reproduced with permission from American Chemical Society [12]. |