 |
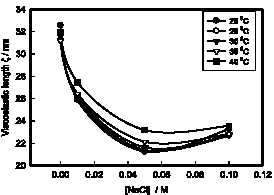
| Figure 22: Plot of viscoelastic length of coacervate samples as function of salt concentration at various temperatures. Notice that samples with higher salt concentration were associated with shorter viscoelastic lengths. Reproduced with permission from American Chemical Society [12]. |