 |
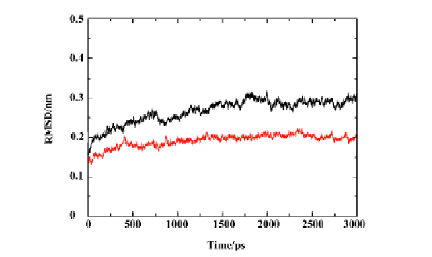
| Figure 3: Time dependence of the RMS deviation from the crystal structure of the uncomplexed PTP1B (black) and the PTP1B-SNA complex (red) for all atoms over the 3-ns MD simulation. Reproduced with permission from Nature Publishing Group Copyright @ 2006 |