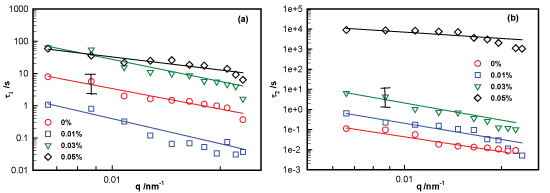
Figure 4:
Plot of q dependence of (a) fast relaxation time (τ1) and (b) slow relaxation time (τ2) for 2% (w/v) laponite with different [IL] concentration ( t = 0). Representative error is shown.