 |
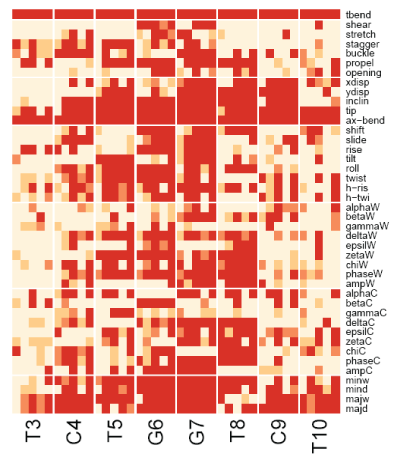
| Figure 7: The heat map for oxaliplatin-DNA from MD runs. The heat-map was presented with four colors: background light pink color refers to Kolmogorov-Smirnov (KS) deviation for a given parameter from that of normal B-DNA in the range of 0 ≤ p<0.8 (p is the probability deviation, as p gets closer to 1, then higher the probability of deviation); dark yellow color refers to KS deviation for a given parameter from that of B-DNA MD run in the range of 0.8 ≤ p<0.9; orange color refers to KS deviation for a given parameter from that of B-DNA MD run in the range of 0.9 ≤ p<0.95; and the brown color refers to KS deviation for a given parameter from that of B-DNA MD run in the range of 0.95 ≤ p<1.0. For each of the 42 morphological parameters, each base (T3 to T10) contains 5 cells representing the five MD runs (either 10 ns or 60 ns). A given morphological parameter, for a given base in platinated-DNA, was assigned as significantly different compared to the same parameter for the same base in B-DNA if at least 4 or more cells were brown in color. For each cell the average data were generated using the uncorrelated samples from MD runs using the RESP charges for oxaliplatin-DNA. |