 |
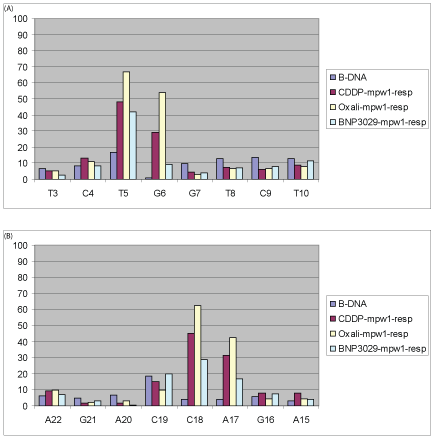
| Figure 11: Averaged percent (%) occupation of A-like sugars (combining C3’-endo, C4’-exo and C2’-exo sugar puckers, panel A: W-strand that has the platinum adduct and panel B: C-strand, the complementary starnd) for the 12-mer DNA (5’-CCTCTggTCTCC-3’) from the platinated-DNA and B-DNA. The average data were generated using the uncorrelated samples from five MD runs using the RESP charges for the platinated-DNA. Panels A and B contain data for Bases 3 to 10 only. |