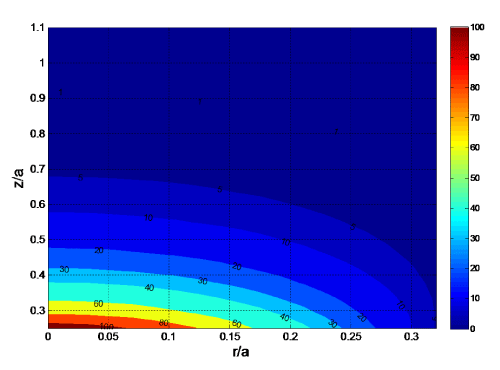
Figure 4:
Contour plot U/k
B
T, corresponding to a half of the cell shown in Figure1b.