 |
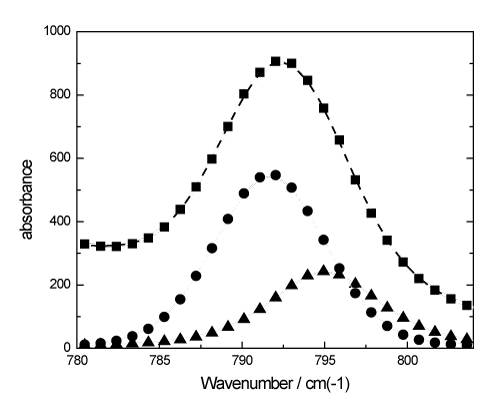
| Figure 8: Curve fitting of the FT-Raman CO stretching region. ■, experimental band; ▲and ●, bands obtained in the fitting process: 795 cm-1and 791 cm-1 corresponding to the monomer and dimer simetric CO stretching vibrational modes, respectively. ----resulting curve. |