 Li et al; Comparative Study of the Phase Diagrams for the Fusion Entropy
and the Intermolecular Interaction between Hydroxypropyl-β-cyclodextrin and
Nifedipine/Nicardipine Hydrochloride
  Li et al; Comparative Study of the Phase Diagrams for the Fusion Entropy
and the Intermolecular Interaction between Hydroxypropyl-β-cyclodextrin and
Nifedipine/Nicardipine Hydrochloride
 |
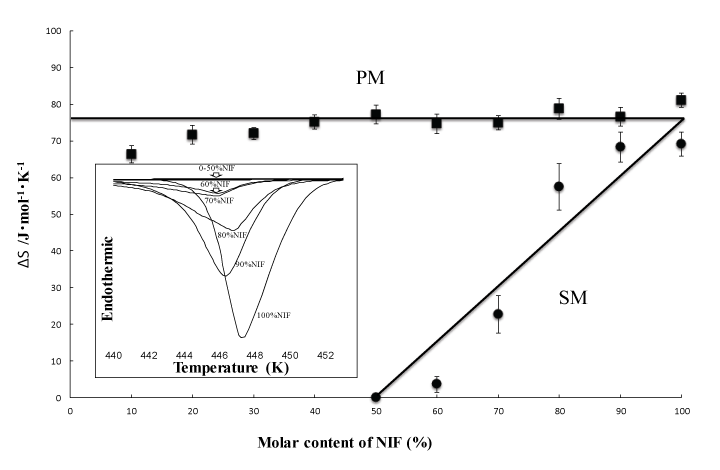
| Figure 2: Phase diagrams of the fusion entropies of crystalline NIF for pure NIF, NIF/HP-β-CD mixtures (90%–10% NIF), and pure HP-β-CD prepared by the PM method (squares), and by the SM method (circles). Values are the mean ± standard deviation of three separate measurements. |