(b) Li et al; Comparative Study of the Phase Diagrams for the Fusion Entropy and the Intermolecular Interaction between Hydroxypropyl-β-cyclodextrin and Nifedipine/Nicardipine Hydrochloride
 (b) Li et al; Comparative Study of the Phase Diagrams for the Fusion Entropy and the Intermolecular Interaction between Hydroxypropyl-β-cyclodextrin and Nifedipine/Nicardipine Hydrochloride |
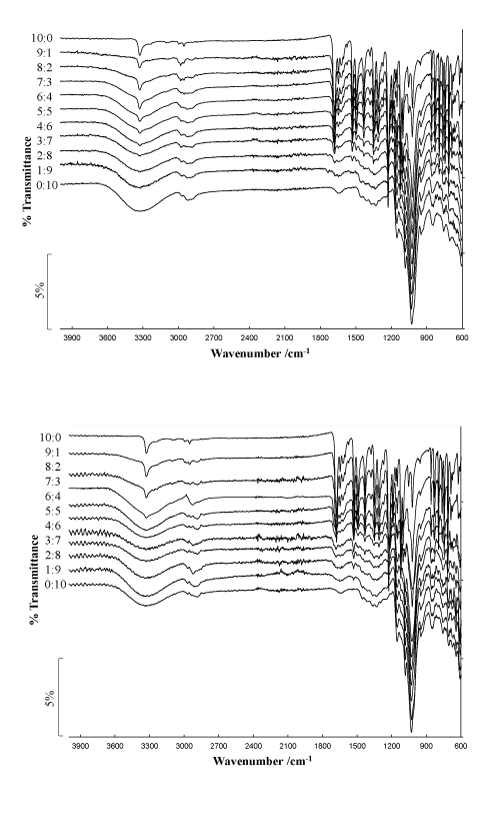
| Figure 8: FTIR spectra of pure NIC-salt, NIC/HP-β-CD mixtures (90%–10% NIC), and of pure HP-β-CD. They were prepared by the PM (a) and SM (b) methods. Subscript numbers on the left of the spectra are the same as the sequences in Figures 1 and 3. |