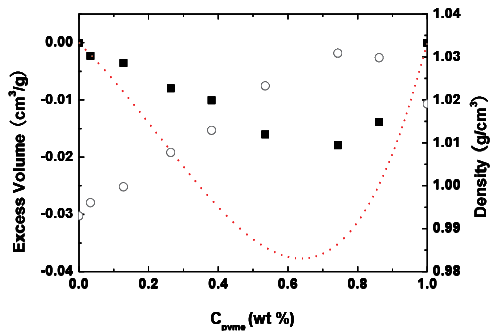
Figure 1:
Excess volumes (■) and densities (○) obtained from NPTsimulations at 300 K. The experimental excess volumes13 according tothe Redlich-Kister polynomial44 are also plotted (…) for comparison. Thedensities correspond to the right y axis.