 |
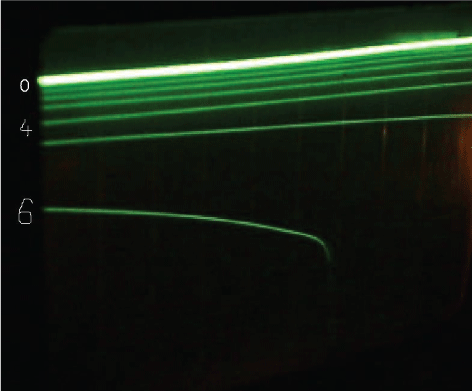
| Figure 6: Oscillograms of the explosion in air chemiluminescence signal. The zero line is the result of superposition of many traces in the absence of the photosignal, it is the bright line located at the top. With increasing photosignal, the oscilloscope trace shifts downwards (traces 1-5). Trace 6 shows the moment when the oscilloscope trace shifts downward almost vertically. This point corresponds to the onset of the explosion. The continuous trigger mode with a sweep rate of 50 μs/cm is used: i.e., a single pass of the trace on the screen takes about 500 μs, whereas the record of six oscillograms lasts for 3-6 ms. |