|
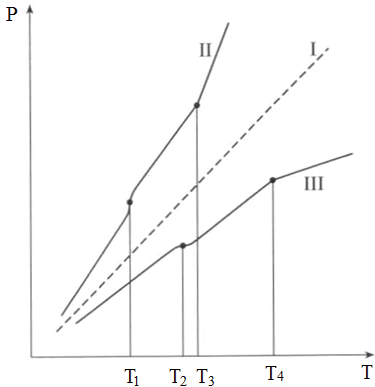
| Figure 2: TThe P-T diagram, schematically. I-the isohore ρ=ρc without kinks and bends, i.e., the cricondetherm on the phase equilibrium line; II and III-the isochors at ρ>ρc and ρ<ρc, accordingly. The kink points at II and III are according to the liquid-liquid phase transitions (with transition points Т1 and Т2), and the bend points are according to the liquid-vapour phase transitions (with transition points Т3 and Т4). |