 |
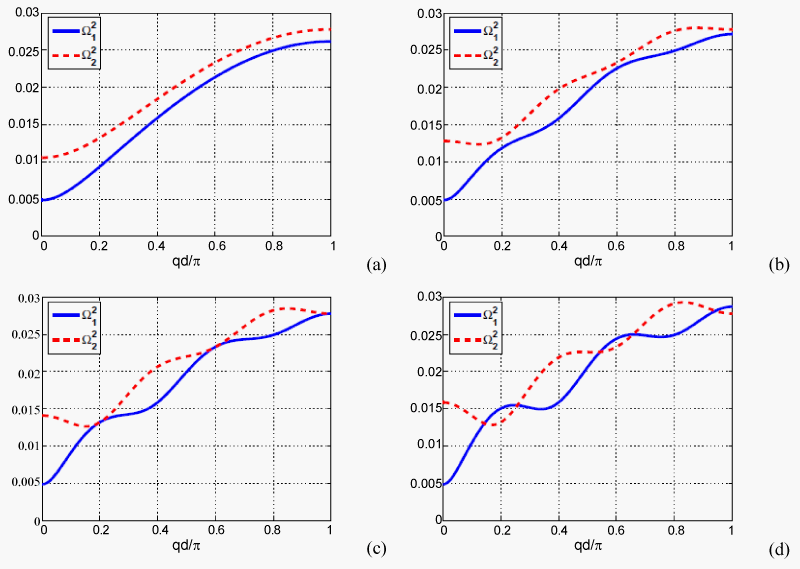
| Figure 1: Optical and acoustic frequencies as a function qd and for different values of Sh and S = 0.3 eV, D = 1.2×10⁻¹ eV, I = 1.8158×10³Å2 amu, λ = 4×10⁻³ eV: Panel (a) shows the dispersion curves for Sh = 0. The curves are similar to those obtained for the discrete sG model. For Sh < Sh;cr, we have the configuration of panel (b). The dispersion curves oscillate and there is no crossing point between the optical and the acoustic curves. When Sh = Sh;cr, there is one crossing point. Panel (d) shows the dispersion curves for S > Sh;cr. In this case, there are two crossing points between the optical and the acoustic curves. |