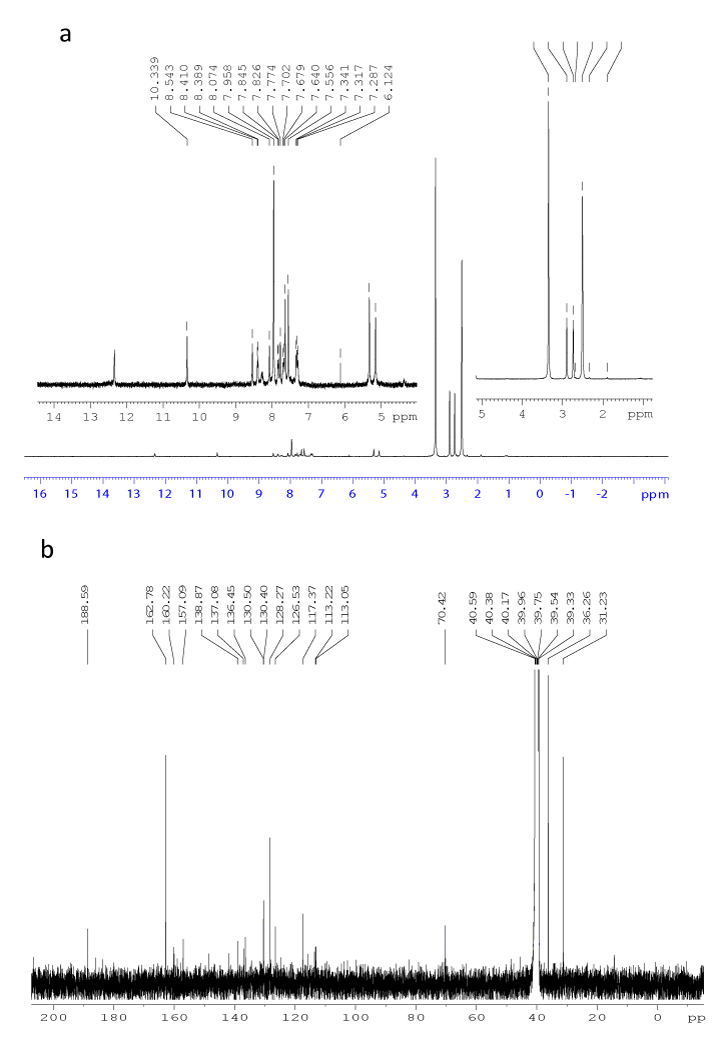
Figure 2:
1
H and
13
C NMR spectra of Schiff base (II).