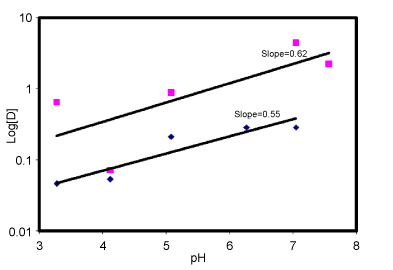
Figure 6:
The plot of log D vs. pH at Constant [H
n
L](V)(¦) Cu(II) (¦) Cr(III) in chloroform.