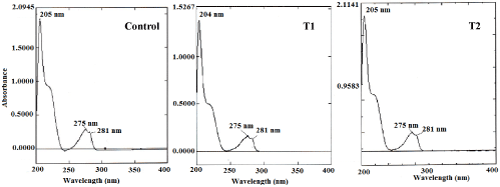
Figure 3:
UV-Vis spectra of control and treated (T1 and T2) samples of resorcinol.