 |
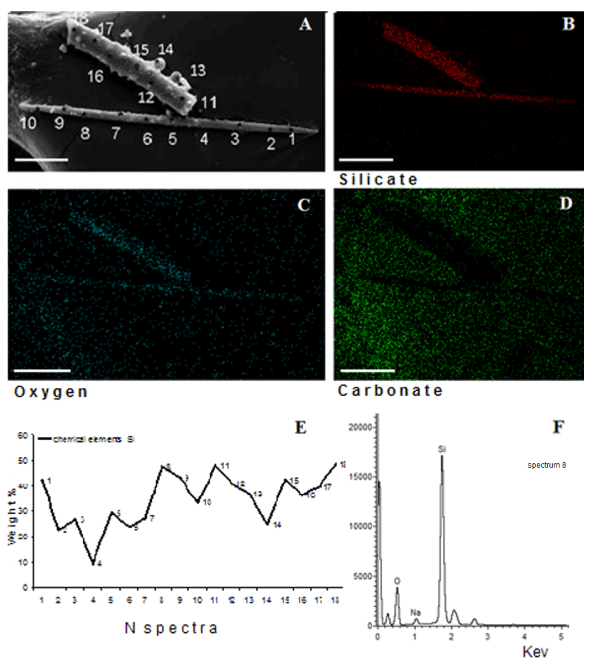
| Figure 6: SEM image of spicules in primmorphs of L. baikalensis cultivated in NBW during three months with the points of spectra (numbers) –– (A); (B – D) X-ray microanalysis (XMRA) spectra obtained for freshwater spicules. (B) silica contents; (C) oxygen contents; (D) carbonate contents analyzed in the wall of spicules. (E) general silica contents of the spicules that were cultivated in NBW are indicated on the spectral diagram as percentages; (F) as an example, we provide spectrum 8, which had a silica content of up to 47.7%. Scale bars: 30 µ. |