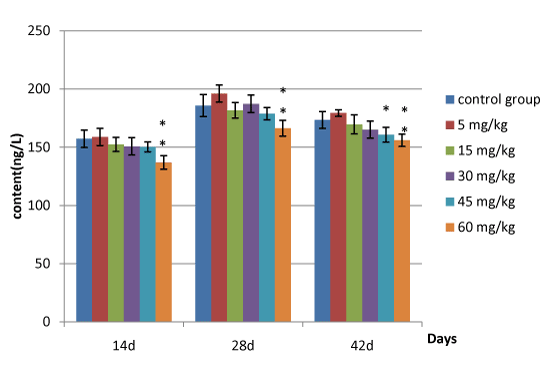
*p<0.05, compared with the control group
**p<0.01, compared with the control group
|
| Data are presented with the means ± standard deviation (n=5) *p<0.05, compared with the control group **p<0.01, compared with the control group |
| Figure 8: Changes of the duodenal IFN-γ contents (ng/L) in broilers |