 |
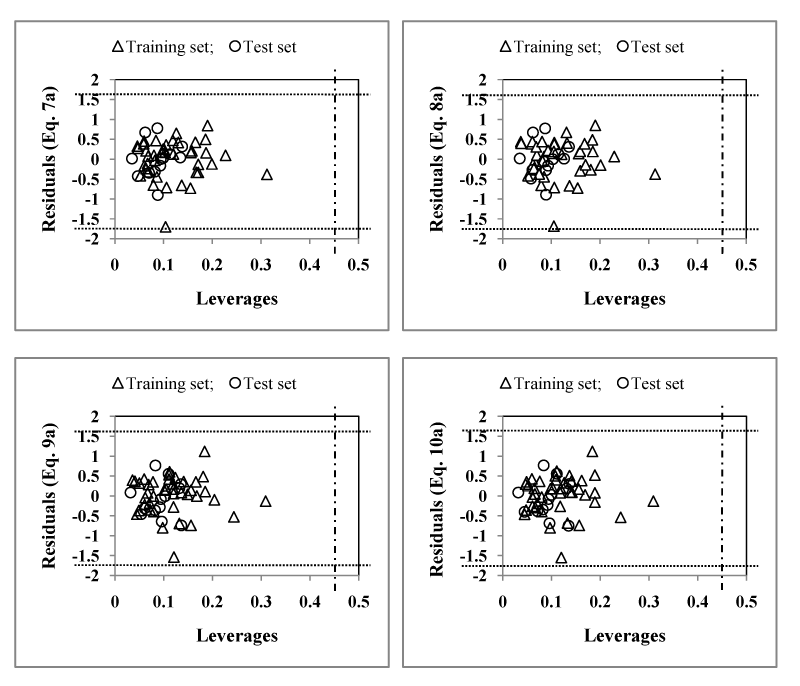
| Figure 4: Williams plot for the training-set and test- set for inhibition activity of MMP-13 for the compounds in Chart 1. The horizontal dotted line refers to the residual limit (± 3×standard deviation) and the vertical dotted line represents threshold leverage h* (= 0.439). |