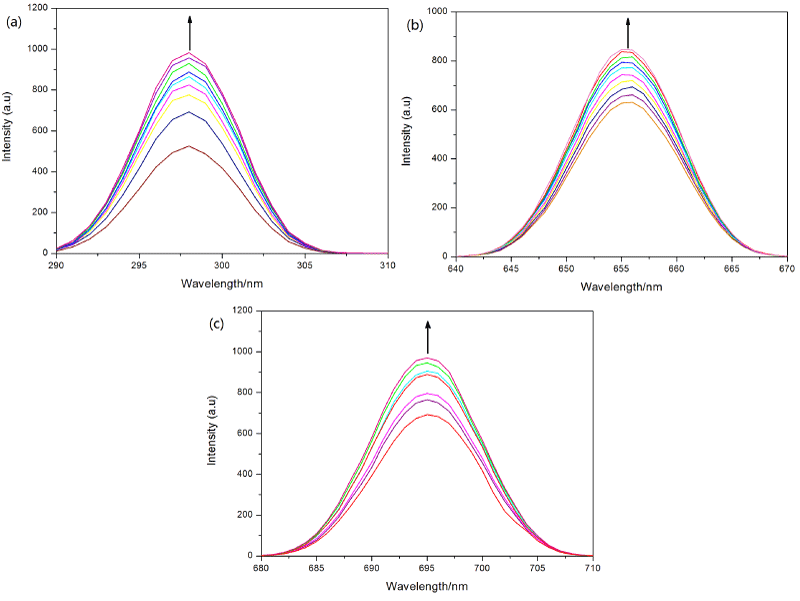
Figure 2:
Emission spectra of 1 (a), 2 (b) and 3 (c) in Tris-HCl buffer A in the absence and presence of CT-DNA. [V] = 20 μmol L
-1
. Arrows show the increasing intensity with increasing concentrations of DNA.