 |
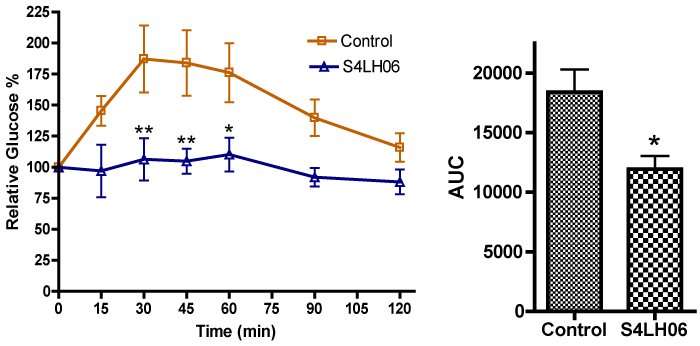
| Figure 5: Glucose Tolerance Test in STZ-Rats. Control group, saline with IP; test group, S4LH06 in saline 25 mg/kg with IP. Left, relative glucose change after glucose load (2 g/kg); right, area under the curve (AUCglucose) of control and test group. *vs. control p<0.05, **vs. control p<0.01. |