 |
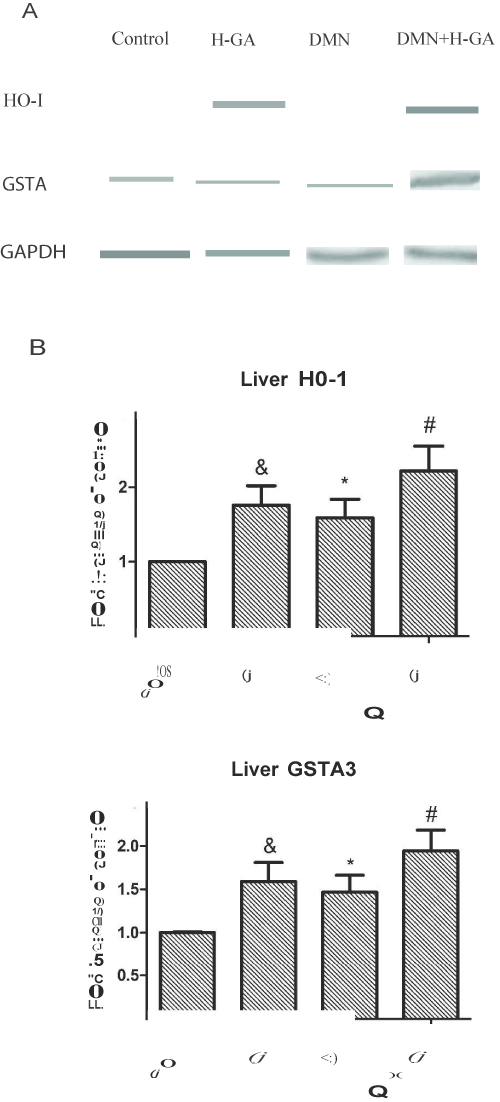
| Figure 7: A Expression of cytoplasmic HO-I and GSTA3 at protein level m different groups. B. The immunoblotting data are representative of eight experiments. GAPDH was used as a loading control. &p<O.Ol vs control group, *p<O.Ol vs control group, #p<O.Ol vs DMN group. |