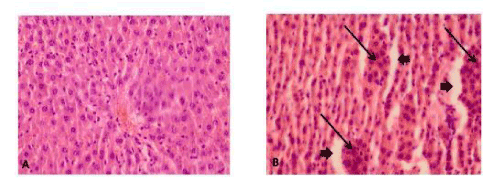
Left Panel (A): Normal liver in diabetic group treated with 800 mg/kg per day of CS fruit extract.
Right Panel (B): The cellular mass, including hepatocytes (long arrow) and the dilated sinusoids (short arrows) in the diabetic group which only received distilled water (control): Magnification 400x.