|
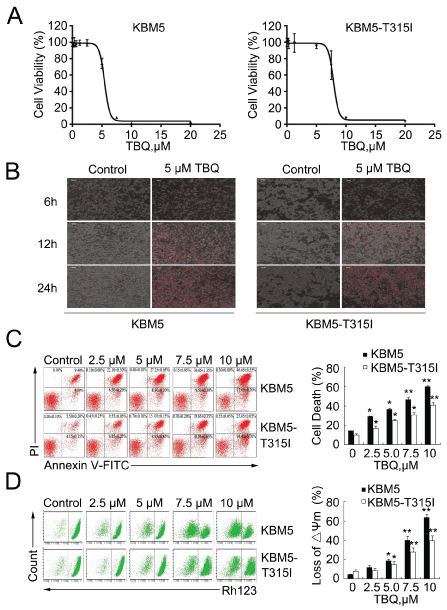
| Figure 1: TBQ induces proliferation inhibition and apoptosis of CML cells. (A) Dose-response curves of CML cells to TBQ. KBM5 and KBM5-T315I cells were cultured with various concentrations of TBQ for 48 hours. Cell viability was then examined by MTS assay. Graphs represent data from three independent experiments. Mean ± SD (n=3). (B) TBQ treatment induced cell death in CML cells. KBM5 and KBM5-T315I cells were treated with TBQ in the indicated concentrations for 6, 12 or 24 hours. Cell death was detected by PI staining. Mean ± SD (n=3). (C) Induction of apoptosis in CML cells by TBQ. KBM5 and KBM5-T315I cells were treated with the indicated concentrations of TBQ for 12 hours; the percentage of cells undergoing apoptosis was determined with Annexin V/PI staining followed by flow cytometry (left). The proportion of apoptotic cells measured by flow cytometry is summarized by the graph at the right side. Mean ± SD, n=3; *P < 0.05, **P < 0.01, versus vehicle control. (D) TBQ decreased the mitochondrial membrane potential in KBM5 and KBM5-T315I cells. Cells were treated with 2.5, 5, 7.5 or 10.0 μM TBQ for 12 hours; mitochondrial membrane potential was detected using rhodamine-123 staining followed by flow cytometry, Mean ± SD (n=3), *P < 0.05, **P < 0.01, versus vehicle control. |