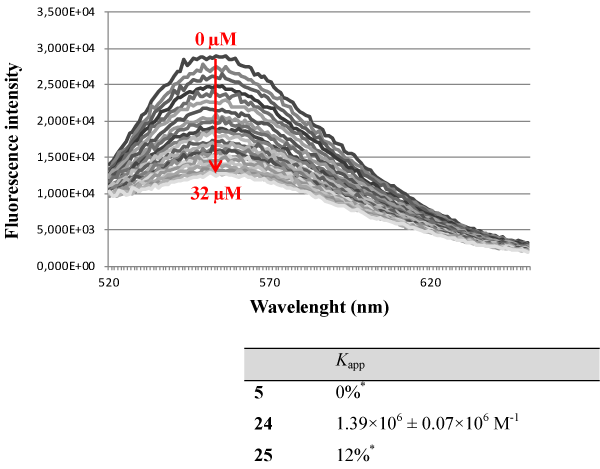
Percentages represent the displacement of BET with 32 μM of compound 5 and 25.
 |
| *Fluorescence variations were too weak to calculate the apparent binding constant. Percentages represent the displacement of BET with 32 μM of compound 5 and 25. |
| Figure 8: Apparent binding constant measured by fluorescence using [BET]/[DNA]=1.26. Fluorescence spectra of DNA-BET complex (λex=546 nm) upon addition of drug (0.1-32 μM) in BPE buffer (pH 7.1). Figure depicting the fitting plots obtained between 520 and 650 nm. |