 |
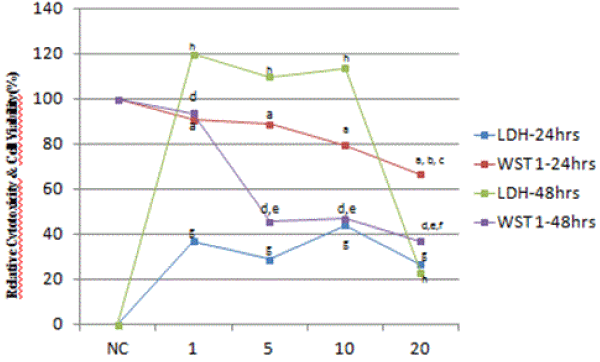
| Figure 1: Results of LDH and WST-1 Assays. AGS cell line treated 24h and 48 h at different concentrations of UDA. NC: Negative Control (Only medium with AGS cell line), 1, 5, 10, 20: UDA concentrations (μg/ml). AGS WST-1 pa≤0.05 compared with control group; pb≤0.05 compared with Lectin-1 group, pc≤0.05 compared with Lectin-5 group 24 hour; pd≤0.05 compared with control group; pe≤0.05 compared with Lectin-1 group, pf≤0.05 compared with Lectin-5 group, 48 hour. AGS LDH-24; pg≤0.05 compared with control group; AGS LDH-48; ph≤0.05 compared with control group; one way ANOVA test. |