 |
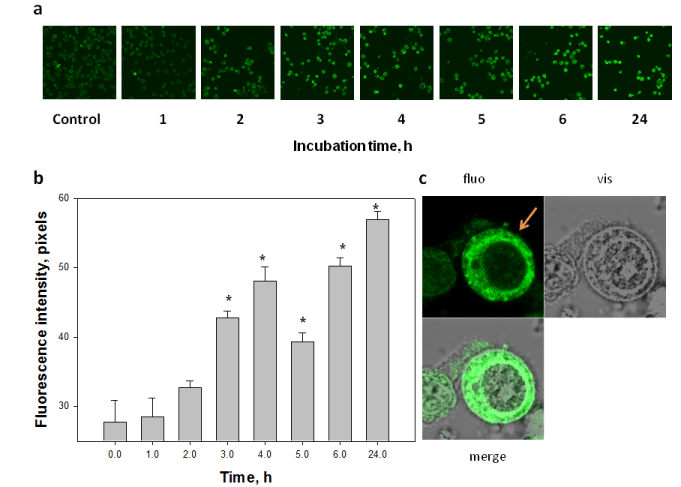
| Figure 3: Immunocytochemical visualization of Hsp70 expression changes in the cells using Hsp70-specific BRM-22a antibody in EAC cells treated with 5 µM U-133. Stained cells and quantified results are presented, respectively (a and b). Zoomed image of stained EAC cell after 2 h incubation with U-133. Arrow indicates cell surface (c). |