 |
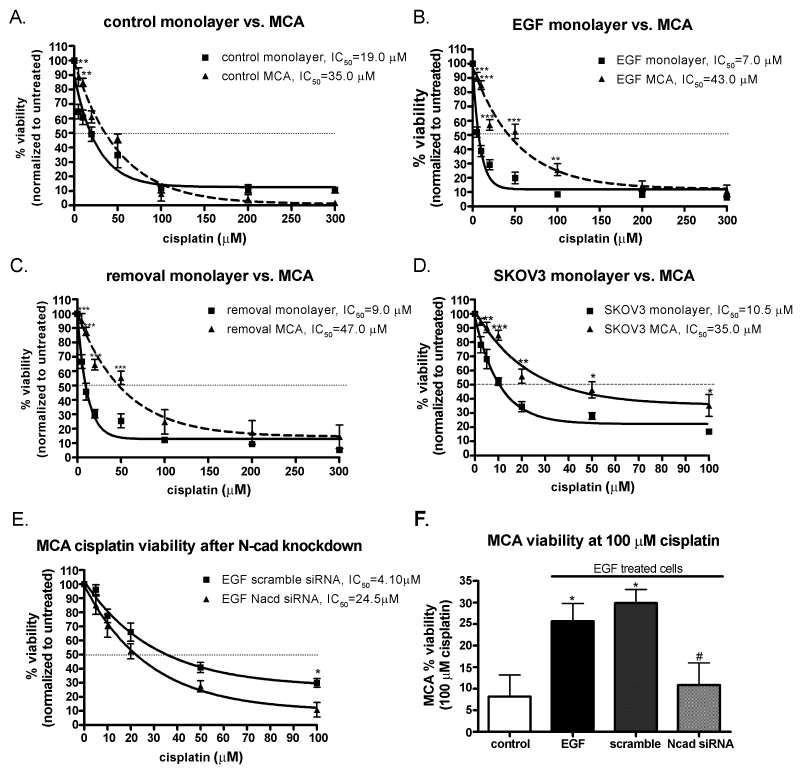
| Figure 6: Compact MCAs demonstrate higher cell viability than monolayer cultures in response to 48hr of cisplatin and cells response to cisplatin is mediated, in part, by N-cadherin expression A) OVCA 433 passage control cell viability for monolayer (solid line) and MCAs (dashed line) in response to cisplatin. Data expressed as a percentage of untreated control cells, n=4. Two way ANOVA showed a significant overall main effect of monolayer vs. MCA [F(1,48)=9.711, p<0.01], a significant effect of cisplatin exposure [F(7,48)=146.1, p<0.001] as well as a significant interaction [F(7,48)=4.971, p<0.001]. Significant differences in viability observed at 5 and 10 μM cisplatin in control cells, **p<0.01. B) Long term EGF treated cells viability for monolayer (solid line) and MCAs (dashed line) in response to cisplatin. Data expressed as a percentage of untreated EGF cells, n=4. Two-way ANOVA of long term treated EGF cells data showed a significant overall main effect of monolayer vs. MCA [F(1,48)=184.7, p<0.001], a significant effect of cisplatin exposure [F(7,48)=205.6, p<0.001] as well as a significant interaction [F(7,48)=14.6, p<0.001]. Significant differences in viability observed at 5, 10, 20, 50 and 100 μM cisplatin in EGF cells, ***p<0.001, **p<0.01. C) Removal cells viability for monolayer and MCAs in response to cisplatin. Data expressed as a percentage of untreated removal cells, n=4. Two-way ANOVA of removal cell data showed a significant overall main effect of monolayer vs. MCA [F(1,48)=73.37, p<0.001], a significant effect of cisplatin exposure [F(7,48)=96.12, p<0.001] as well as a significant interaction [F(7,48)=4.873, p<0.001]. Significant differences in viability observed at 5, 10, 20 and 50 μM cisplatin in removal cells, ***p<0.001. D) SKOV3 cell viability for monolayer and MCAs in response to cisplatin. Data expressed as a percentage of untreated SKOV3 cells, n=4. Two-way ANOVA of SKOV3 cell data showed a significant overall main effect of monolayer vs. MCA [F(1,42)=64.95, p<0.001], a significant effect of cisplatin exposure [F(6,42)=82.17, p<0.001] as well as a significant interaction [F(6,42)=2.592, p<0.05]. Significant differences in viability observed at 5, 10, 20, 50 and 100 μM cisplatin in SKOV3 cells, ***p<0.001, **p<0.01, *p<0.05. E) MCA cell viability in long term EGF treated cells with either scramble siRNA or Ncad siRNA in response to cisplatin. Data expressed as a percentage of untreated long term EGF cells, n=5. Two-way ANOVA of Ncad knockdown cell data showed a significant overall main effect of siRNA [F(1,48)=14.74, p<0.001], a significant effect of cisplatin exposure [F(5,48)=84.80, p<0.001] with no significant interaction. Significant differences in viability observed at 100 μM cisplatin in Ncad knockdown cells, *p<0.05. F) MCA percent viability data for passage control, EGF treated cells without siRNA or with scramble siRNA or Ncad siRNA at 100 μM cisplatin, n=4-5. One way ANOVA followed by post hoc analysis showed a significant increase in long term EGF treated cells and long term EGF treated cells with scramble siRNA compared to passage control, *p<0.05. Long term EGF treated cells that were given Ncad siRNA showed a significant decrease from both EGF treated cells and long term EGF treated cells with scramble siRNA, #p<0.05. |