 |
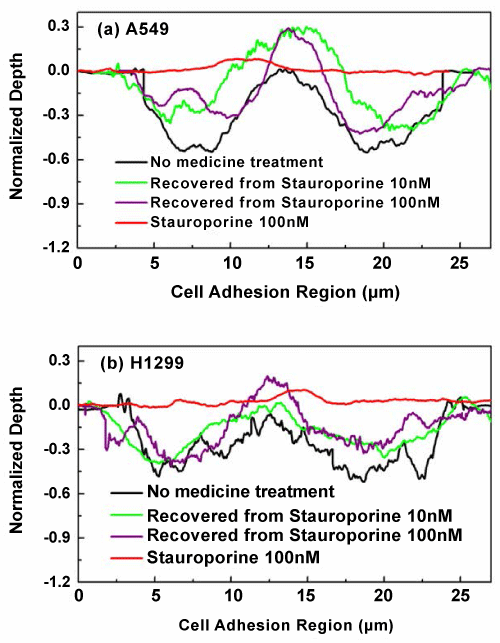
| Figure 7: Normalized PCRSM profiles for the cancer cells (a) A549, (b) H1299 obtained through culturing the cells in Staurosporine-containing medium with concentration of 10 and 100 nM, respectively, for 24 h followed by replacing the culture medium with anticancer medicine free ones for another 24 h period. |