 |
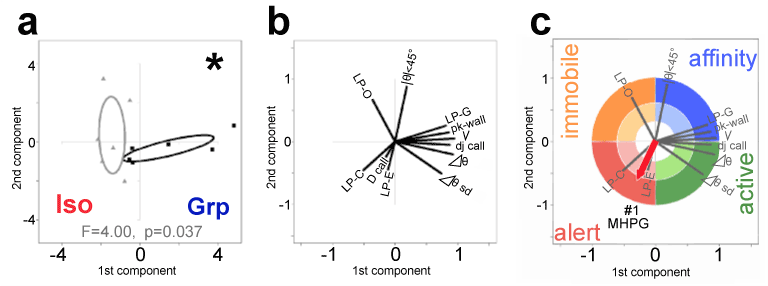
| Figure 2: The multivariate analysis of eleven behavioral factors and the correlation analysis with behaviors and a monoamine concentration in a brain sub-region. a. The data distribution of Grp (right) and Iso (left) behavior during the behavior test in the context 3. Two experimental chick groups were prepared and tested with social interaction behavior at postnatal day 13. The behavior factors were extracted from the video recording, quantified, and the feature vectors of the behavior were computed by principal components analysis as described in Materials and Methods. The principal scores of each subject was plotted in a plane, x axis is the first component score and y axis is the second component score. The plot was assigned to each group and the distribution of the plots (n=6) in either group was demarcated by variance ellipse (asterisk: significantly different by Wilks’ lambda with the F and p values) b. The eleven factor loading vectors in the projected plane a. The factor loading vector was calculated as the correlation of behavior eigen vector with the first or second component of principal components analysis giving the value between -1 and +1 (0 means no correlation) after normalization by eigen value of each component. Only positive value was illustrated in the panel c. Illustration of four emotional quadrants in the feature space of the behavior. The clustering of the factor loading vectors and emotional expression with each behavior gave four clusters in the feature space and we labeled each cluster by emotional behavior, like active (green), immobile (orange), affinity (blue), and alert (red). The quadrant border was arbitrarily assigned. The correlation of a monoamine (in this case MHPG, a metabolite of norepinephrine) in a brain subregion (in this case #1, left lateral frontal, Figure 3f) with behaviors was based on Pearson product-moment correlation coefficient (R) computed using the monoamine concentration and the first component score or second component score of each subject, which was derived by PCA of behavior factors (Fig.2a). Thus obtained monoamine vector was color coded according to the location of the vector in four emotional quadrants. The color density indicates as ‘0.3<R<0.6 (shorter length vector, light)’ or ‘R>=0.6 (longer length vector, dark)’ |