|
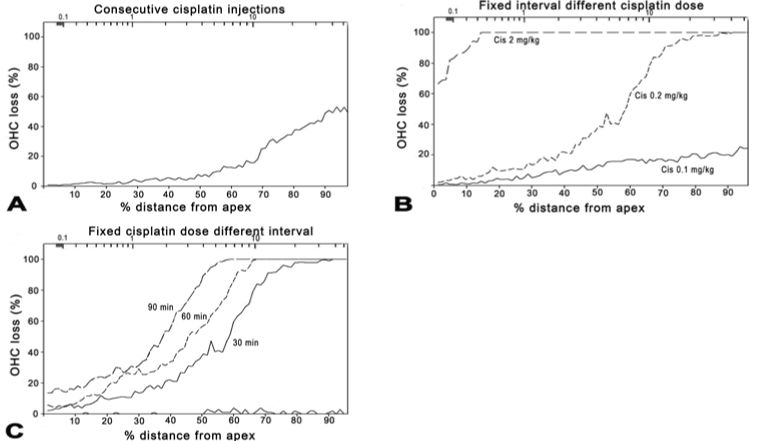
| Figure 4: Cochleogram of OHC loss. %OHC loss was measured as a function of distance from the apex to the base (lower horizontal axis) against the norm established using the control animals. The upper horizontal axis is the frequency of the region based upon the frequency-place map [36]. (a) Consecutive Cis injection group. OHC loss was more severe in the basal turn and milder in the apical turn. (b) Co-administration of Cis at various doses but a fixed interval (30 min) after furosemide. (c) Administration of fixed-dose Cis (0.2 mg/kg) at various intervals after furosemide. |