 |
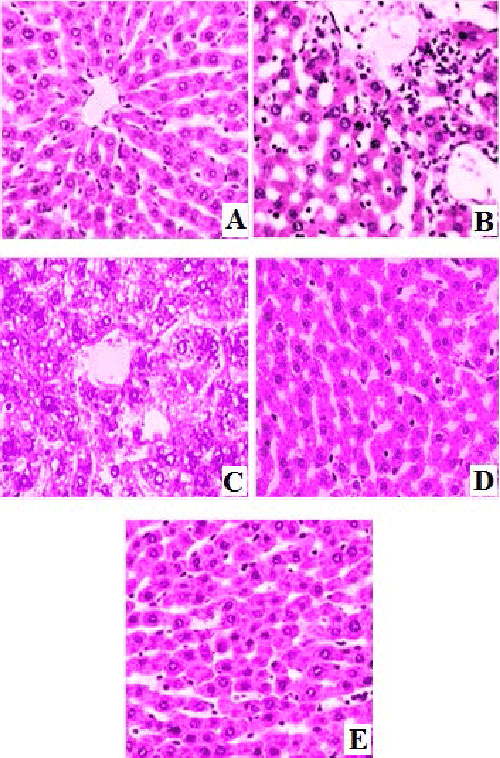
| Figure 7: Representative photographs from the liver of control and experimental rats: Histologic features (A-E) of liver sections stained with H&E treatment. Typical images were chosen from each experimental group. (Original magnifications 200X). (A) Control group showing normal hepatic architecture. (B&C) Arsenic treated group showing the severe hepatocellular necrosis, inflammatory cell infiltration and apoptotic changes in liver tissue. (D) THC+ Arsenic treated group showing almost normal histological features of liver. (E) THC alone treated rat showing normal showing the normal histological features of liver tissue. |