 |
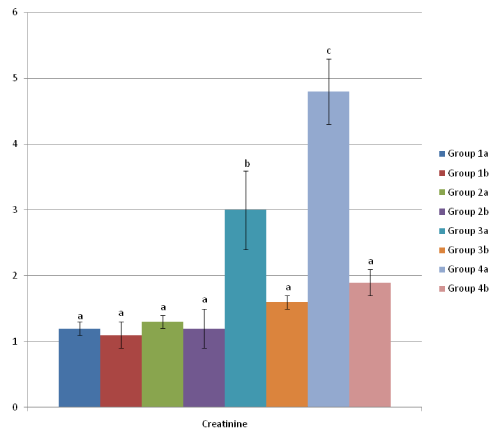
| Figure 3: Serum creatinine (mg/dl) levels in the Control rats orally gavaged with 0.5 ml saline water for 60 days (Group 1a), Control rats withdrawn from oral gavage with 0.5 ml saline water for 60 days (Group 1b), Control rats orally gavaged with 0.5 ml of vegetable oil for 60 days (Group 2a), Control rats withdrawn from oral gavage with 0.5ml of vegetable oil for 60 days (Group 2b), Test rats orally gavaged with 4.0 mg/kg bw of gasoline fuel for 60 days (Group 3a), Test rats withdrawn from oral gavage with 4.0 mg/kg bw of gasoline fuel f or 60 days (Group 3b), Test rats orally gavaged with 4.0 mg/kg bw of diesel fuel for 60 days (Group 4a) and Test rats withdrawn from oral gavage with 4.0mg/kg bw of diesel for 60 days (Group 4b). Each value represents mean ± SEM; n = 6; bP≤ 0.05 compared to a & c; cP≤ 0.05 compared to a. |