|
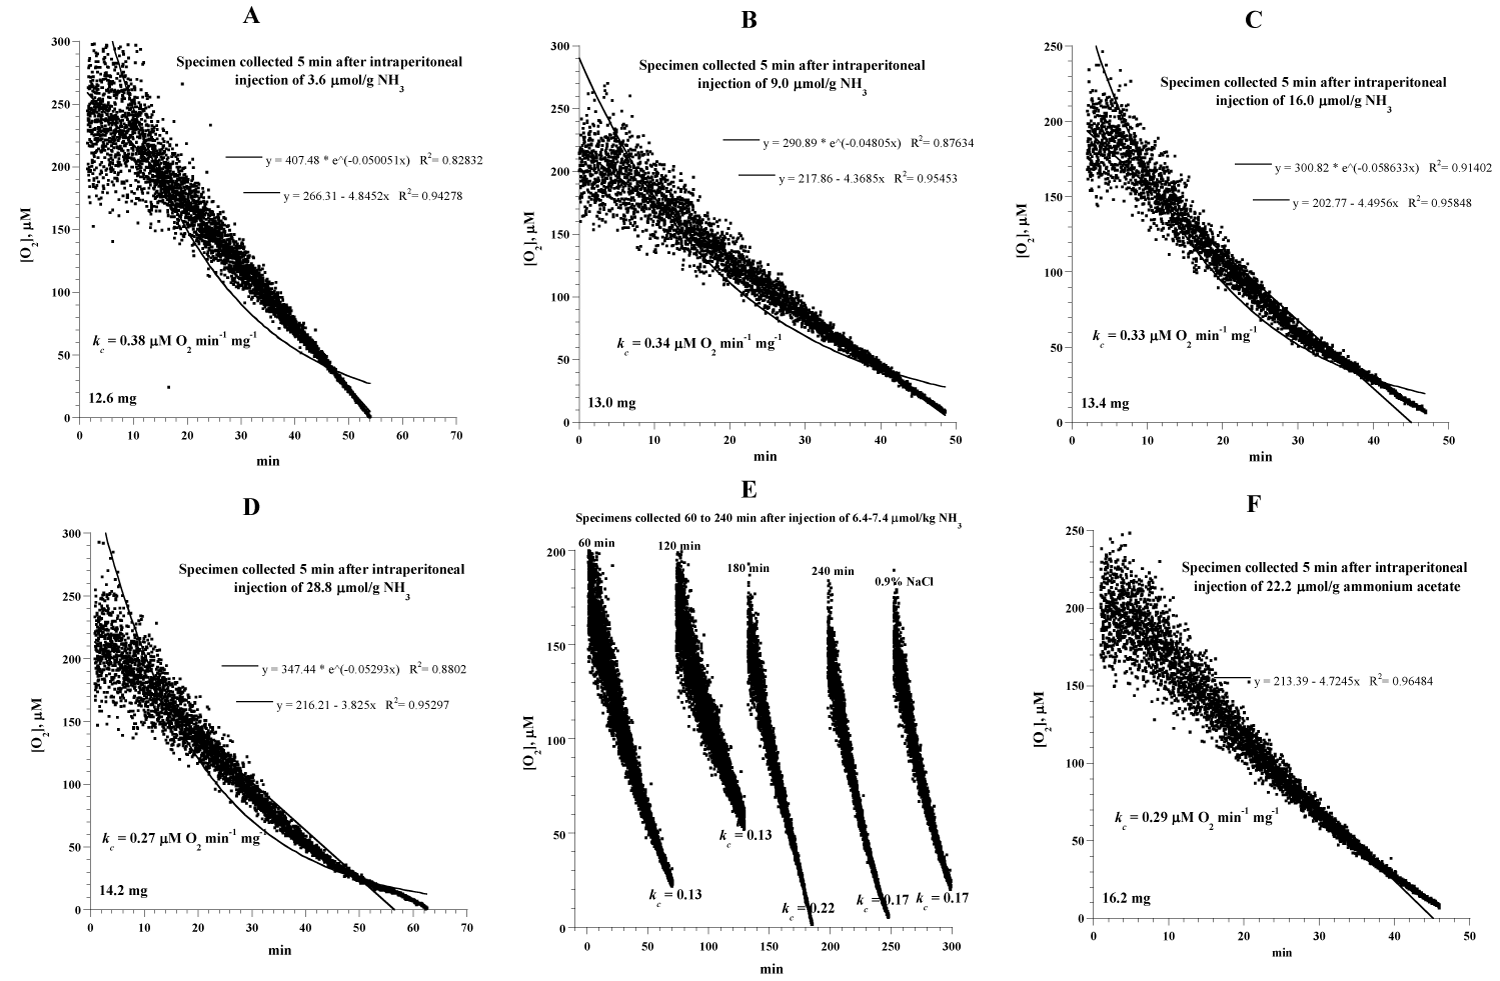
| Figure 3: Cellular respiration after in vivo treatment with ammonia. Ammonia (3.6 to 28.8 μmol/g) was injected intraperitoneally and forebrain specimens were collected 5 to 240 min after treatment. Representative runs of O2 consumption in PBS+5 mM glucose are shown. The lines are exponential and linear fits. The values of kc (μM O2 min-1 mg-1), specimen weight and fitting equations are shown. |