 |
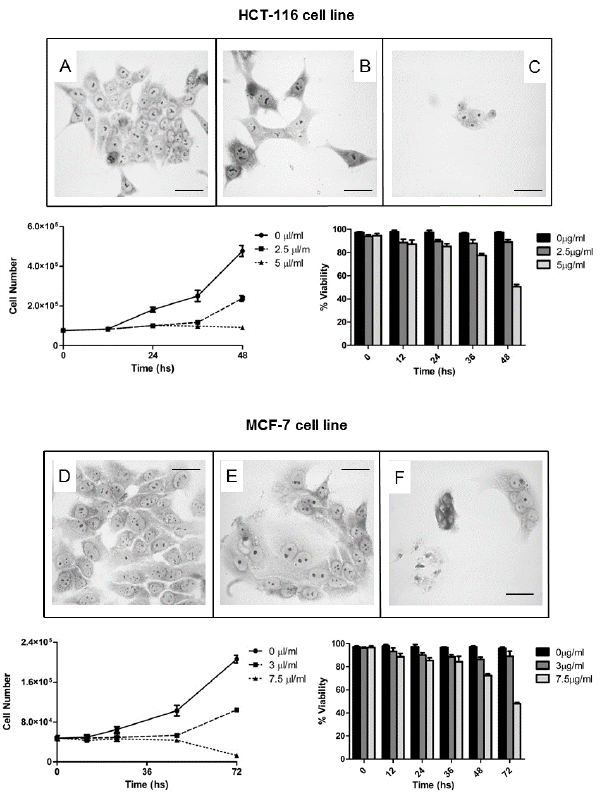
| Figure 2: Time-response effect of P. strombulifera crude extract on HCT-116 and MCF-7 cell lines. A, B and C show optical microscopy of HCT-116 cells before and after treatment with the respective IC50 and LC50 concentrations of extract. D, E and F show the same conditions in MCF-7. Cell number and viability is presented at 0, 12, 24, 36 and 48 hrs in HCT-116; and 0, 12, 24, 36, 48 and 72 hrs in MCF-7. Time course of 0 μg/ml, IC50 and LC50 concentrations are presented for both cell lines. Proliferation and viability results are shown as mean ± SEM of three different assays performed in triplicate. |