 |
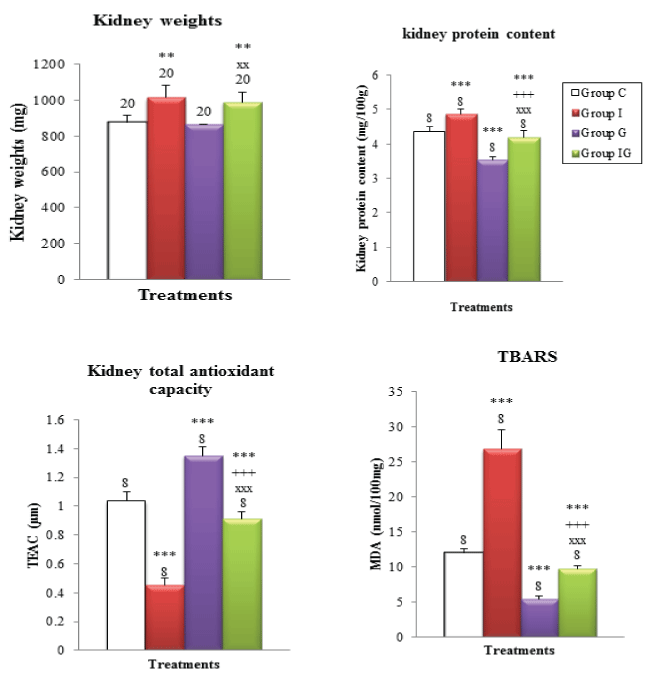
| Figure 2: Kidney weights (mg), protein content (mg/100g), TEAC (μmol) and TBARS (nmol/l) kidney contents of young rats: controls (group C) and treated for a period of 45 days by FeCl2 (group I), by garlic (group G) or by both FeCl2 and garlic (group IG). Treated I, G and IG vs controls C: **: P≤0.01; ***: P ≤ 0.001, Treated IG vs treated I: +++: P ≤ 0.01, Treated IG vs treated G:xx:P ≤ 0.01; xxx: P≤0.001 |